The Problem: You’re Running 15 Campaigns But Can Only Show Them One at a Time
Picture this: Your university’s Giving Day is in full swing. Engineering is competing against Medicine. Business School alumni are going head-to-head with the College of Arts & Sciences. The Class of 2015 wants to beat the Class of 2010.
You’ve got 15 separate GoFundMe Pro campaigns running simultaneously, each with its own fundraising page, its own progress bar, its own donor list.
But when someone asks “How much have we raised total?”—you have to open 15 tabs, copy numbers into a spreadsheet, add them up manually, and by the time you’re done, the numbers are already outdated.
Your board wants to see unified impact. Your donors want to know the collective momentum. Your marketing team needs current totals to share on social media.
GoFundMe Pro doesn’t offer this natively. Each campaign lives in its own silo. There’s no built-in way to say “show me the total across Engineering, Medicine, Business, and Arts combined” or “what’s our grand total across all 15 class year campaigns?”
If you’re nodding along, you’re not alone. This is one of the most common frustrations we hear from nonprofits running multiple concurrent GoFundMe Pro campaigns.
The good news? Campaign aggregation is not only possible—it’s transformative.
Why Campaign Aggregation Matters
Before we dive into solutions, let’s talk about why this matters so much for different stakeholders in your organization.
For Board Members & Executives
Your board doesn’t want to see 15 individual campaign totals. They want the big picture: “We raised $2.3 million across all schools” or “Our corporate partners contributed $847K combined.”
Campaign aggregation gives you executive dashboards that show:
- Total raised across all campaigns
- Overall participation rate
- Top-performing segments at a glance
- Progress toward organizational goals (not just individual campaign goals)
Translation: Better board reports, faster decision-making, clearer strategic visibility.
For Donors & Participants
When donors see a unified total, they understand the collective impact. Instead of “Engineering raised $50K,” they see “Together, all schools raised $2.3M—and Engineering led the way with $50K.”
This creates:
- Momentum: “We’re already at $1.8M toward our $2M goal!”
- Social proof: “12,847 donors have given so far”
- Competitive motivation: “We’re 85% to our goal—let’s push over the finish line”
Individual campaigns feel isolated. Aggregated totals feel like a movement.
For Marketing & Communications Teams
Your marketing team is probably creating static graphics in Canva every few hours, manually updating numbers, and watching them go out of date before the post finishes uploading. With campaign aggregation, you can:
- Auto-update totals on your homepage
- Share accurate numbers instantly
- Show progress across all initiatives simultaneously
- Celebrate milestones as they happen (“We just crossed $1M!”)
For Campaign Managers
You’re juggling 15 campaigns and need to know which ones are performing, which need attention, and what the overall trajectory looks like. Campaign aggregation gives you one dashboard instead of 15 tabs, comparative performance at a glance, and the ability to spot trends in real-time. Less time in spreadsheets, more time fundraising.
What Most Organizations Do Wrong (And Why It Doesn’t Work)
Let’s be honest about the “solutions” most organizations default to—and why they’re all terrible in practice.
Manual Spreadsheet Tracking
The manual spreadsheet approach seems reasonable at first. You open each GoFundMe Pro campaign in a separate tab, copy the total raised into a spreadsheet, sum the columns, maybe create a chart if you’re feeling ambitious.
Why it fails:
- Takes 20+ minutes every time you want an update
- Numbers are outdated immediately (by the time you finish, new donations have come in)
- Prone to errors (copy/paste mistakes, missed campaigns)
- Doesn’t scale (imagine doing this hourly during a 24-hour Giving Day)
- Can’t share dynamic updates
Reality check: This is busywork masquerading as strategy.
Static Graphics Updated Periodically
Some organizations have a designer create graphics showing current totals, update them every few hours, and post on social media. This is labor-intensive, creates lag (graphics are outdated before you finish posting), and means you’re always reporting yesterday’s news. By the time you create the “We hit $1M!” celebration graphic, you’re actually at $1.1M and people who were watching feel like they missed something.
Highlighting One Campaign While Ignoring Others
Then there’s the approach where you just feature one campaign prominently and hope people extrapolate. This alienates constituencies who wonder why they’re never featured, misses the bigger story of unified impact, and limits participation. If you’re an Arts & Sciences alum and never see your school mentioned, you might think “they don’t need my help” and move on. You’re leaving money on the table.
GoFundMe Pro’s Native Features (Which Don’t Include Aggregation)
Everyone’s first instinct is to check if GoFundMe Pro just does this natively. It doesn’t. GoFundMe Pro shows individual campaign totals, period. You can’t create “super campaigns” that roll up multiple campaigns. Their reporting shows campaigns separately. There’s no way to create unified progress bars or combined leaderboards. If aggregation is what you need, you need something beyond base GoFundMe Pro.
 The Solution: Real Campaign Aggregation
Here’s what becomes possible when you implement proper campaign aggregation, not workarounds.
Unified Progress Tracking
Instead of fifteen separate progress bars scattered across different pages, you show one unified view with:
- Grand total: $2,347,892 raised across all campaigns
- Unified goal: Progress toward $2.5M organizational goal
- Near-real-time updates: Numbers update every 1-2 minutes (with smart caching to handle traffic)
- Drill-down capability: Click to see individual campaign breakdowns
- Timestamp transparency: “Updated 47 seconds ago” so everyone knows data freshness
Example from Columbia Giving Day:
Main page shows: “$2.3M raised by 12,847 donors across all schools”
Click “Engineering” to see: “$287K from 1,243 Engineering donors”
Click “Medicine” to see: “$412K from 1,891 Medicine donors”
All updating throughout the 24-hour event
Note: Donor counts represent estimated unique donors based on email deduplication where available. Anonymous gifts are included in totals but excluded from recognition walls per privacy settings.
Comparative Leaderboards
Beyond just showing totals, you can display rankings that create the friendly competition that drives giving:
- School vs. School: Engineering ($287K), Medicine ($412K), Business ($198K)
- Corporate Partners: Home Depot ($2M), Microsoft ($1.1M), Local Business ($50K)
- Class Years: Class of 2015 (437 donors), Class of 2010 (392 donors)
- Regional Chapters: NYC Chapter ($127K), LA Chapter ($89K), Chicago Chapter ($76K)
All pulled from separate GoFundMe Pro campaigns but displayed together for comparison. The competitive element motivates individual groups while the aggregated total shows collective achievement.
Multi-Dimensional Views
The same data can be viewed from different angles to tell different stories to different audiences:
- Total raised across all campaigns
- Total raised by campaign type (peer-to-peer vs. direct)
- Total raised by constituent group (alumni vs. parents vs. friends)
- Total raised by donation size bracket
- Hourly breakdowns during Giving Days
Automated Reporting
Instead of manually creating reports, you have systems that update themselves:
- Board dashboards: Auto-updates with current totals and visible timestamps
- Email alerts: Pre-scheduled emails at key milestones without manual triggering
- Social media graphics: Auto-generated with current numbers (requires automation tools like Zapier)
- Website widgets: Embedded progress bars that update automatically
Note: Automated graphics and scheduled emails require additional automation tools beyond the base aggregation system.
Real-World Use Cases: When Campaign Aggregation Makes the Biggest Impact
Let’s look at specific scenarios where aggregation moves from “nice to have” to “absolutely essential.”
University Giving Days
The scenario: You’ve got 10-15 separate campaigns for different schools, colleges, or class years. It’s a 24-hour competitive event. Alumni want to see their school win, but the university wants to show total impact.
With aggregation, the main page shows the grand total prominently: “Columbia raised $2.3M from 12,847 donors.” Right below it, there’s a school leaderboard: “Medicine leads with $412K, followed by Engineering at $287K.” There might be a separate class year competition: “Class of 2015 has the most donors (437).”
The data updates throughout the day, creating urgency. Someone checks at noon and sees their school is in second place. They text their college roommate: “We’re only $20K behind Medicine—we can beat them!”
Why it matters: Donors see both competitive rankings AND collective impact. They’re helping their school win AND contributing to the university’s success. It’s not either/or.
Multi-City Run/Walk Events
The scenario: The same event is happening in 15+ cities simultaneously. Each city has its own GoFundMe Pro campaign. The national organization wants to show the movement is bigger than any one location.
What aggregation enables:
- National total: “$1.8M raised across 15 cities”
- City leaderboard: “Chicago: $284K (487 participants), NYC: $247K (412 participants)”
- Combined participant count: “3,195 walkers nationwide”
- Unified progress bar: “We’re 90% to our $2M national goal!”
Why it matters: Participants see local pride (Chicago is winning!) but also see themselves as part of a national movement. If you’re in a smaller city that raised $45K, you’re not isolated—you’re one of 3,195 people nationwide who showed up.
Corporate Workplace Giving Challenges
The scenario: Multiple corporate partners each run their own campaign. Departments within each company compete against each other. Your organization wants to show total corporate support.
What aggregation enables:
- Corporate total: “Our corporate partners raised $3.2M”
- Company leaderboard: “Home Depot: $2M, Microsoft: $1.1M, ABC Corp: $500K”
- Department drill-down: “Home Depot IT: $287K leads all departments”
- Combined participation: “4,127 employees gave”
Why it matters: Companies get recognition for their total contribution. Departments compete internally. The nonprofit shows corporate support is a massive part of their funding model. Everyone wins.
Regional Chapter Campaigns
The scenario: National nonprofit with 20+ regional chapters. Each chapter runs its own campaign. The national office needs unified totals while chapters want local ownership.
What aggregation enables:
- National total: “$4.7M raised across all chapters”
- Regional rankings: “West region: $1.2M, Northeast: $987K, Midwest: $876K”
- Chapter-by-chapter view: “Seattle chapter: $247K (leading West region)”
- Per-capita metrics: “Austin chapter: Highest average gift at $142”
This lets smaller chapters compete on different metrics (average gift, participation rate) rather than just total dollars, which levels the playing field.
Capital Campaigns with Multiple Funding Priorities
The scenario: Multi-year capital campaign with different fundraising priorities (building, endowment, program). Board wants to see progress toward total goal and individual priorities.
What aggregation enables:
- Campaign total: “$28.7M raised toward $30M goal (96%)”
- Priority breakdown: “Building: $15M/$15M (100%), Endowment: $10.2M/$12M (85%), Program: $3.5M/$3M (117%)”
- Estimated unique donors: “1,247 donors across all priorities”
- Time-based progress: “Year 1: $12M, Year 2: $16.7M (current)”
The board sees holistic progress. Donors understand where their gift fits. Priorities near completion can be celebrated while others get focused attention.
Note: Multi-year historical aggregation is possible if campaigns were on GoFundMe Pro for those years and API access includes that historical range.
 How Campaign Aggregation Actually Works (Technical Overview)
You don’t need to be technical to benefit from aggregation, but understanding the basics helps you evaluate providers and set realistic expectations.
The Data Collection Process
The system connects to GoFundMe Pro’s API and pulls data from each campaign you specify:
- Total amount raised
- Number of donations
- Campaign-specific data (team names, fundraiser names, etc.)
- Timestamps for tracking
Important note on donor data: Personal information (names, emails) is subject to privacy settings, consent requirements, and your data processing agreement with GoFundMe Pro. Anonymous gifts are included in dollar totals but excluded from public recognition displays to honor donor privacy.
Aggregation & Calculation
The system processes data according to rules you define:
- Sums totals across specified campaigns
- Calculates participation rates
- Ranks campaigns by various metrics
- Tracks progress toward goals
- Identifies trends and patterns
About unique donor counts: When you see “12,847 unique donors,” that’s an estimate based on email deduplication where available. Anonymous gifts, masked emails, and duplicate identities mean it’s not 100% precise—but it’s far more accurate than not deduplicating at all.
Near-Real-Time Display
Here’s the reality about “real-time” that nobody talks about: it’s not actually real-time in the technical sense. The system typically updates every 1-2 minutes during active campaigns. Why not every second? API rate limits exist to protect both GoFundMe Pro’s servers and keep costs manageable.
The smart approach uses caching—storing recent data locally so your website can serve it instantly to thousands of visitors without making a fresh API call for each page load. During high-traffic events, you might have thousands of people checking simultaneously. Caching keeps everything fast.
Your display shows “Last updated: 47 seconds ago” so visitors know the data is current, just not to-the-second.
Where webhooks are available (sometimes for transaction events), certain updates can happen faster—your system gets notified “Mary just donated $50” immediately. But most aggregation work still requires scheduled API polling.
Flexible Configuration
You control:
- Which campaigns to aggregate
- How to group them (by school, region, type, etc.)
- What metrics to display publicly vs. internally
- Update frequency (balanced with API quotas and performance)
- Visual styling to match your brand
What You Can Display with Aggregated Data
Once aggregation is set up, you’re not limited to just showing one big total. Here are the most common and effective displays:
Unified Progress Thermometer: One big progress bar showing total across all campaigns, with drill-down to individual campaign details
Comparative Leaderboards: Rankings by total raised, number of donors, average gift size, or participation rate—updating throughout the campaign
Geographic Heat Maps: If campaigns are location-based, visualize donor concentration, total raised per region, and regional rankings
Time-Based Analysis: Hourly totals during Giving Days, day-by-day progress during multi-day campaigns, year-over-year comparisons (if historical data available)
Participation Metrics: Estimated unique donors (deduped by email), participation rate by segment, new vs. returning donors (requires historical data)
Goal Tracking: Overall progress toward organizational goals, individual campaign progress, stretch goals, milestone celebrations
Case Study: Columbia University Giving Day
Let’s get concrete with how one organization used aggregation to drive record-breaking results.
The Challenge:
Columbia was running their annual Giving Day with multiple schools competing—Engineering, Medicine, Business, Arts, and more. They had 15+ separate GoFundMe Pro campaigns and needed to show both individual school performance and total university impact simultaneously during a 24-hour event with a global alumni base.
The Aggregation Strategy:
Their main dashboard featured a hero number: “$2.3M raised” (updating every 1-2 minutes). Below that, a donor count: “12,847 donors” (estimated unique count). A school leaderboard showed which school was leading, with rankings shifting throughout the day. A progress bar showed movement toward their $2.5M stretch goal.
Individual school pages showed school-specific totals, rankings, and donor honor rolls (respecting anonymity preferences).
The Technical Implementation:
API pulled data from all 15 campaigns every 1-2 minutes. Smart caching handled heavy traffic during peak hours. Everything was mobile-optimized. “Last updated” timestamps were prominent.
The Results:
From an aggregation perspective:
- Board saw current totals during meetings without bothering staff
- Marketing posted accurate updates all day without manual calculation
- Alumni saw both competitive rankings and collective impact
- Competitive element drove participation throughout the event
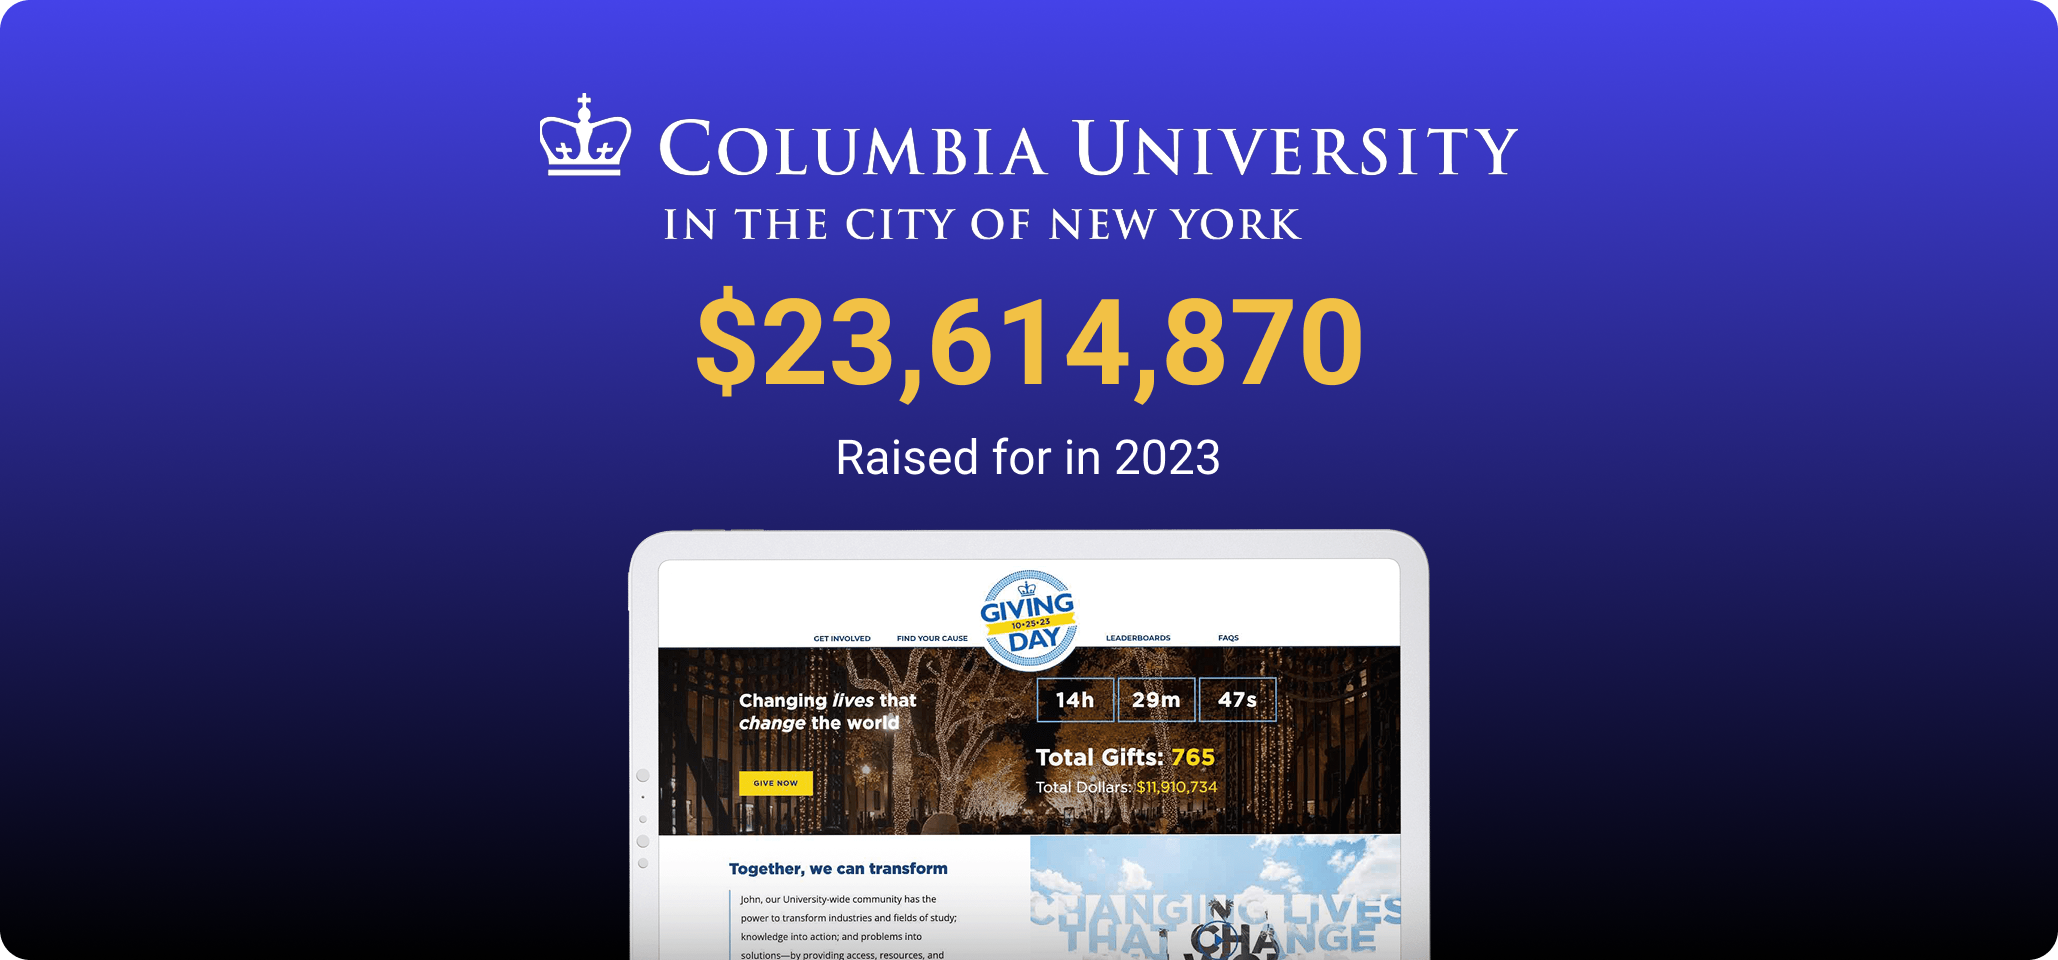
The numbers: $2.3M raised (3x previous year), 12,847 donors (estimated unique), strong retention throughout 24 hours, participation from 87 countries.
The takeaway: Aggregation wasn’t just a “nice to have”—it was central to the strategy. Without it, they’d have been stuck manually updating totals and missing the competitive element that drove urgency.
How to Implement Campaign Aggregation
If you’re sold on the benefits, here’s what implementation actually looks like.
Step 1: Audit Your Current Campaign Structure
Answer these questions:
- How many GoFundMe Pro campaigns do you run simultaneously?
- How are they organized? (by school, region, campaign type, etc.)
- What’s your current process for tracking combined totals?
- Who needs access to aggregated data? (board, staff, public)
- What metrics matter most to your stakeholders?
Step 2: Define Your Aggregation Rules
Decide:
- Which campaigns should be aggregated together
- How to group them
- What displays publicly vs. internally
- Update frequency (balanced with API resources and performance needs)
- What triggers milestone alerts
Example rules: “Aggregate all 15 school campaigns into ‘Total University Giving.’ Show school-by-school leaderboard ranked by total raised. Update every 1-2 minutes during Giving Day with smart caching, hourly otherwise. Send alert when we cross $1M, $1.5M, $2M milestones.”
Step 3: Choose Your Implementation Approach
Option A: Professional Integration Solution
- Proven platform handles aggregation automatically
- Pre-built dashboards and displays
- Support included
- Faster implementation (4-6 weeks)
- Budget: $10K-25K depending on complexity
Option B: Custom Development
- Fully tailored to your specific needs
- Complete control over features and display
- Dedicated team for ongoing support
- Timeline: 12-16 weeks
- Budget: $75K+ for enterprise solutions
We don’t recommend: Building this yourself unless you have dedicated developers who understand API rate limits, pagination, caching strategies, and can maintain it long-term.
Step 4: Configure & Customize (2-4 weeks)
- Connect to your GoFundMe Pro campaigns via API
- Set up aggregation rules
- Design visual displays
- Customize styling to match your brand
- Configure admin dashboards
- Establish data refresh schedules
Step 5: Test & Train (1-2 weeks)
- Test with sample data
- Verify update intervals
- Check mobile responsiveness
- Confirm timestamp displays
- Train staff on dashboards
- Create documentation
Step 6: Launch & Monitor
During your campaign, monitor for accuracy, watch for technical issues, and gather feedback. Post-campaign, review performance and refine for next time.
Common Questions About Campaign Aggregation
“Can’t we just add up the numbers manually?”
You can, but it takes 20+ minutes each time, numbers are outdated immediately, it’s prone to errors, doesn’t scale during high-volume events, and your team’s time is better spent fundraising. Manual aggregation is like using a calculator instead of a spreadsheet. Sure, it works, but why?
“What if our campaigns aren’t all on GoFundMe Pro?”
If you’re using multiple platforms, aggregation gets more complex but is still possible. You can use custom integration that pulls from multiple APIs, though we recommend standardizing on one platform if possible—it simplifies everything.
“How often do the numbers update?”
Typically every 1-2 minutes during high-stakes events like Giving Days (with caching), every 15 minutes for regular campaigns, or hourly for long-term initiatives. More frequent updates require more API calls and careful rate-limit management. All displays include “last updated” timestamps.
Where webhooks are available, certain updates (like new donations) can trigger faster, but most aggregation data requires scheduled API polling.
“What happens if one campaign hasn’t started yet?”
No problem. The system shows current totals from active campaigns, placeholders for upcoming ones, and updates the total once new campaigns go live. During a Giving Day, you might see “5 schools have launched: $127K total” in the morning, then “All 15 schools now live: $1.2M total” by midday.
“Can we aggregate historical data from past campaigns?”
Yes, if your campaigns were on GoFundMe Pro for those years and your API access includes that historical range. This is useful for year-over-year comparisons, multi-year capital campaigns, annual reports showing cumulative impact, and donor retention analysis.
Historical depth depends on platform data retention and your API scope.
“Does this work for peer-to-peer campaigns with hundreds of fundraisers?”
Absolutely. You can show total raised across all fundraisers, display top fundraiser leaderboards, show team totals, calculate averages, and track participation rates—all pulled automatically.
Performance optimization (pagination, batch jobs, caching) is critical when aggregating hundreds of fundraisers.
“How do you handle anonymous donations?”
Privacy-first approach: Anonymous gifts are included in total dollars raised but excluded from public donor recognition walls. Donor names display only when donors have explicitly allowed it. The system respects opt-out preferences and complies with GDPR, CCPA, and platform privacy settings.
The Investment: What Campaign Aggregation Actually Costs
Let’s talk numbers, because budget matters.
Professional Integration (Productized Solution)
What you get: Pre-built aggregation system, standard dashboards and displays, campaign configuration, training and documentation, ongoing support and updates
Investment: Starting around $10K-15K for initial implementation
Ongoing: Typically included in annual support/maintenance fees
Best for: Organizations running regular campaigns (annual Giving Days, recurring events)
Custom Enterprise Solution
What you get: Fully customized aggregation logic, custom dashboards tailored to your needs, advanced features, white-glove implementation, dedicated support team, ongoing optimization
Investment: $75K+ for comprehensive solutions
Best for: Large organizations ($10M+ annual budget), complex multi-campaign strategies, universities, national nonprofits
The ROI Calculation
Consider this scenario: You’re running a Giving Day with a $2M goal.
Without aggregation: Staff spends 20 hours manually tracking totals. Graphics are always outdated. Donors don’t see momentum. You miss the urgency that drives final donations. You fall short at $1.8M.
With aggregation: Frequent updates create urgency. Clear leaderboards drive competitive giving. Automatic milestone alerts trigger surge donations. You exceed goal at $2.1M.
The math:
- Cost of aggregation: $15K
- Additional revenue from better execution: $300K
- ROI: 20:1
Plus intangible benefits: staff time saved, better board reporting, cleaner data for future planning, donor satisfaction with transparency.
Next Steps: Getting Started with Campaign Aggregation
Ready to stop manually tracking totals and start showing aggregated data?
If you’re in planning mode:
Document your current pain points – How many campaigns do you run simultaneously? How much time do you spend manually calculating totals? What questions does your board ask that you can’t answer easily?
Define your dream scenario – What would you display on your website? What internal dashboards would help your team? What reports would make board meetings easier?
Check your timeline – When’s your next major campaign? How much lead time do you have? Can you pilot with a smaller campaign first?
If you’re ready to implement:
Request a demo – See aggregation in action with real examples specific to your use case
Get a custom quote – Share your campaign structure, discuss your specific needs, understand timeline and investment
Plan implementation – Map out your campaign schedule, identify key stakeholders, set success metrics
Questions to ask any provider:
- How many concurrent campaigns can you aggregate?
- Can we change aggregation rules mid-campaign?
- What’s the data update frequency and how do you handle API rate limits?
- Can we exclude specific campaigns from totals?
- What kind of historical data can you aggregate (and what are the limitations)?
- Do you offer custom dashboards or just standard views?
- What happens if GoFundMe Pro changes their API or experiences downtime?
- What’s included in ongoing support?
- How do you handle donor privacy and anonymous gifts?
- What’s your approach to data accuracy and “last updated” transparency?
The Bottom Line: Stop Counting Manually, Start Showing Impact
If you’re running multiple GoFundMe Pro campaigns simultaneously, you’re already doing the hard part—building campaigns, recruiting participants, driving donations.
Why handicap yourself with manual tracking and outdated totals?
Campaign aggregation isn’t a luxury—it’s essential infrastructure for organizations running sophisticated fundraising initiatives.
Your board deserves frequent visibility into accurate data. Your donors deserve to see collective impact. Your team deserves tools that work as hard as they do.
The technology exists. The question is: Are you ready to use it?
About Mittun
Mittun is an official GoFundMe Pro Marketplace partner specializing in nonprofit fundraising technology. We’ve powered 400+ campaigns raising over $50M, including record-breaking giving days for Columbia University ($2.3M in 24 hours), City of Hope, and hundreds of other organizations.
Our campaign aggregation solutions range from ready-to-deploy integration to fully custom enterprise dashboards. Whether you’re running 5 campaigns or 50, we’ll help you show unified impact with accurate, timely data.
Ready to stop counting manually?
Questions?
Email: hello@mittun.com | Phone: 310-737-2987
Tags: #GoFundMePro #CampaignAggregation #NonprofitTechnology #GivingDay #FundraisingData #UnifiedTracking #DataVisualization