The Problem With Most Fundraising Campaigns
Your fundraisers are working in isolation.
They create their fundraising pages, share them once or twice, maybe send an email to their network. Then… crickets. They have no idea if they’re doing well or poorly. They don’t know if $250 is impressive or underwhelming. They can’t see what successful fundraisers are doing differently.
So they give up.
This is why most peer-to-peer campaigns see the same depressing pattern: 20% of fundraisers do most of the work while 80% raise almost nothing. It’s not that those 80% don’t care. It’s that they’re fundraising in a vacuum with no frame of reference, no motivation, and no visibility into what’s possible.
Leaderboards solve this problem immediately.
A leaderboard does something simple but powerful: it makes the invisible visible. Suddenly, fundraisers can see exactly where they stand. They know what “good” looks like. They feel the pull of competition. They want to climb the rankings.
When we implement leaderboards for our clients’ campaigns, we consistently see 40-50% increases in funds raised compared to identical campaigns without them. One university giving day saw donations jump 47% year-over-year when they added school-based leaderboards.
This isn’t magic. It’s psychology. And you can use it too.
Why Fundraising Leaderboards Work: The Psychology of Competition
Before we talk about implementation, let’s understand why leaderboards are so effective at driving donor behavior.
Social Proof: “Other People Are Doing This”
Humans look to others to determine what’s normal and what’s worth doing. When you see a leaderboard showing that 15 teams have already raised over $10K, your brain processes this as social proof: “This is what high performers do. This level of engagement is achievable and expected.”
Without a leaderboard, a fundraiser who’s raised $500 might think they’re doing great. With a leaderboard showing top fundraisers at $5K+, that same person realizes there’s room to grow—and gets motivated to try harder.
Competition: “Can We Beat Them?”
Even people who claim they’re not competitive respond to leaderboards. Why? Because being visible on a list feels like participation in something bigger. Nobody wants to be at the bottom. Most people want to move up. Some people desperately want to reach the top.
Different people engage with competition differently:
- The winners are motivated to stay #1
- The climbers are motivated to move up the rankings
- The participants just want to be visible on the board
- The underdogs are motivated to prove themselves
A good leaderboard engages all of these psychological types simultaneously.
Loss Aversion: “We’re Going to Lose Our Spot”
Studies show humans are more motivated to avoid losing something than to gain something of equal value. When your school is ranked #2 and you see #3 gaining on you, the fear of losing your position creates urgent action.
This is why leaderboards that update frequently (every 1-2 minutes during a giving day) drive so much more engagement than static lists. The rankings are always in flux, creating constant motivation to act.
Recognition: “We Want to Be Seen”
Public recognition satisfies a deep human need. Being listed on a leaderboard—especially in the top spots—provides social status and acknowledgment. People will work harder to achieve something that will be publicly celebrated.
This is amplified when leaderboards are shared beyond just the campaign page. When schools take screenshots of their ranking and share them on social media, the recognition spreads further and motivates even more action.
FOMO: “Everyone Else Is Participating”
When you can see 50 teams actively fundraising and climbing the leaderboard, you feel left out if you’re not part of it. Fear of missing out compels people to join the action, even if they weren’t initially motivated to participate.
 Types of Fundraising Leaderboards (And When to Use Each)
Not all leaderboards are created equal. Different campaigns benefit from different leaderboard structures. Here’s how to choose the right one:
1. Total Dollars Raised
What it is: Rankings based on who’s raised the most money, period.
When to use it:
- Peer-to-peer campaigns where individual fundraisers compete
- Corporate challenges where companies want bragging rights
- University giving days with school vs. school competition
Pros: Simple, clear, directly tied to your fundraising goal. Everyone understands it immediately.
Cons: Can discourage smaller fundraisers or teams who feel they can’t compete with the big players.
Example: “Top 10 Fundraisers” showing individuals ranked by total raised, or “School Rankings” showing which academic schools have raised the most during a giving day.
2. Number of Donors (Participation-Based)
What it is: Rankings based on how many people have given, not how much they’ve raised.
When to use it:
- When you want to encourage broad participation over large gifts
- University campaigns where engaging more alumni matters
- Community campaigns where diversity of support is the goal
Pros: Levels the playing field. A small team can compete by activating their entire network, even if individual gifts are smaller.
Cons: Can result in many small gifts rather than transformational donations if not balanced with other metrics.
Example: “Class Year Participation” showing which graduation years have the highest percentage of alumni giving, or “Most Donors Recruited” for peer-to-peer fundraisers.
3. Participation Rate (Percentage-Based)
What it is: Rankings based on the percentage of a group that has participated.
When to use it:
- Corporate workplace giving (percentage of employees who donated)
- University campaigns (percentage of living alumni from each class year)
- Community campaigns with defined groups (percentage of neighborhood households)
Pros: Creates fairness. A small department with 100% participation can beat a large department with 30% participation. This motivates complete mobilization.
Cons: Requires knowing the total size of each group, which can be data-intensive.
Example: “Department Participation Rate” showing which company departments have the highest percentage of employees giving.
4. Per-Capita Fundraising
What it is: Average amount raised per person in a group.
When to use it:
- When groups are very different sizes and you want fair competition
- Multi-location events where some cities are much larger than others
- Team-based campaigns where team sizes vary widely
Pros: Small but highly engaged groups can compete against much larger groups.
Cons: Can be confusing for some audiences to understand the math.
Example: “Average Raised Per Team Member” so a 5-person team raising $2,500 ($500/person) can beat a 50-person team raising $10,000 ($200/person).
5. Activity-Based (Non-Monetary)
What it is: Rankings based on actions taken, not money raised.
When to use it:
- Walk/run/ride events tracking miles, steps, or minutes
- Ambassador programs tracking shares or recruits
- Engagement campaigns tracking actions completed
Pros: Separates fundraising from other valuable behaviors, allowing multiple ways to “win.”
Cons: Requires systems to track and verify activities accurately.
Example: “Most Miles Logged” for a walk-a-thon, or “Most Social Shares” for an ambassador program.
6. Streak-Based
What it is: Rankings based on consecutive participation (consecutive giving days, consecutive monthly gifts, consecutive years participating).
When to use it:
- Multi-year campaigns where you want to reward loyalty
- Monthly giving programs
- Annual campaigns where repeat participation matters
Pros: Rewards long-term commitment, not just big one-time actions.
Cons: New participants can never catch up to long-time supporters, which may discourage them.
Example: “Longest Giving Streak” showing donors who’ve given to every campaign for the past 5+ years.
Nonprofit Leaderboard Best Practices: What Actually Drives Results
Here’s what we’ve learned from building dozens of leaderboards for campaigns that have raised millions:
1. Update Frequently (Every 1-5 Minutes)
Static leaderboards are boring. Live leaderboards are addictive.
During a 24-hour giving day, rankings should update every 1-2 minutes. People will refresh obsessively to see if their school moved up, if they’re still in the top 10, if they’re about to be passed. Each refresh is an opportunity for them to decide to give again or share with their network.
For longer campaigns (weeks or months), updating every 5-15 minutes is sufficient. The key is that people see movement happening regularly, not just once a day.
Pro tip: Show a “Last updated” timestamp so people know the data is current. Nothing kills trust faster than seeing rankings that are clearly hours out of date.
2. Show More Than Just the Top 3
If your leaderboard only shows the top 3 spots, 97% of participants will never see themselves on it. That’s demotivating.
Better approach:
- Show top 10-20 spots to give more people visibility
- For large campaigns, show top 25 or even top 50
- Consider paginated leaderboards where people can scroll through all rankings
Even better: Show personalized views where logged-in users always see their own ranking highlighted, along with the people directly above and below them. This creates “I can beat the person right above me” motivation.
3. Use Multiple Leaderboards
Don’t make people choose between competing on only one metric. Give them multiple ways to win.
Example for a university giving day:
- Main leaderboard: Total dollars raised by school
- Secondary: Number of donors by school
- Tertiary: Participation rate by class year
- Bonus: Top 25 individual fundraisers
This way, the School of Medicine can win total dollars, the School of Education can win participation rate, the Class of 2010 can win most donors, and individual star fundraisers still get recognition.
Multiple leaderboards mean more winners, more motivation, and broader engagement.
4. Set Minimum Thresholds
If anyone can appear on a leaderboard after raising $5, the board becomes cluttered and less meaningful.
Better: Set minimum thresholds for visibility. For example:
- “Top Fundraisers (minimum $250 raised)”
- “Leading Teams (minimum 5 members)”
- “Top Schools (minimum 10 donors)”
This ensures leaderboards showcase actual achievement rather than just participation, which makes being on the board more prestigious.
5. Make It Shareable
Every time someone shares a screenshot of the leaderboard showing their school in the lead, you get free marketing. Make this easy.
How:
- Include social sharing buttons directly on leaderboard page
- Auto-generate shareable graphics: “We’re #1! Help us stay there”
- Create unique URLs for each team/school’s leaderboard view
- Encourage participants to share updates: “We just moved up 3 spots!”
When sharing the leaderboard becomes part of the competitive dynamic, you multiply engagement exponentially.
6. Celebrate Movement, Not Just Position
Don’t just show current rankings. Highlight changes.
Examples:
- Show up/down arrows next to rankings (↑ moved up 2 spots)
- Highlight “Biggest Climbers” in last hour
- Show “On Fire” badges for teams that just made big jumps
- Create alerts: “Engineering just passed Arts & Sciences for #2!”
Movement creates narrative and drama. Drama drives engagement.
7. Balance Competition With Mission
Never let people forget WHY the competition matters.
Do this:
- Include impact messaging alongside leaderboards: “Every school in the top 10 has helped fund 50+ scholarships”
- Show collective progress: “Together, all schools have raised $1.2M”
- Celebrate everyone: “32 schools participated—incredible turnout!”
The competition is the vehicle. The mission is the destination. Keep both visible.
8. Design for Mobile First
Most people will check leaderboards on their phones, especially during intensive 24-hour campaigns.
Requirements:
- Leaderboards must be fully responsive and easy to read on small screens
- Rankings should load quickly even on slower mobile connections
- Touch-friendly interfaces for scrolling through long lists
- Shareable directly from mobile devices
Test everything on actual phones before launch. A clunky mobile experience kills engagement.
 How to Implement Fundraising Leaderboards (Three Approaches)
Depending on your resources and timeline, here are three ways to add leaderboards to your campaigns:
Manual Leaderboards: No-Code Solution for Immediate Implementation
What it is: Create graphics showing rankings and update them manually throughout the campaign.
How to do it:
- Export fundraising data from your platform (hourly or daily)
- Create a simple graphic in Canva showing top 10-15 rankings
- Post updated graphics to your website, email, and social media
- Update every few hours during intensive campaigns, daily for longer ones
Pros:
- Zero cost
- No technical requirements
- Can start immediately
Cons:
- Labor-intensive
- Not truly “real-time”
- Requires staff availability throughout campaign
Best for: Small campaigns, testing whether leaderboards work before investing in tech, organizations with very limited budgets.
Automated Leaderboards: API Integration for Real-Time Updates
What it is: Integrate your fundraising platform’s API with your website to display rankings that update automatically.
What you need:
- Developer to build API integration
- Website where you can add custom features
- Access to your fundraising platform’s API
- Design for how leaderboards will look
Pros:
- Updates automatically (every 5-15 minutes typically)
- Professional appearance
- Minimal ongoing labor
- Can handle complex logic (multiple leaderboards, filters, etc.)
Cons:
- Requires upfront investment
- Takes 4-6 weeks to build properly
- Dependent on your platform’s API capabilities
Best for: Organizations running regular peer-to-peer campaigns, annual giving days, or recurring events where the investment pays off over time.
Custom Fundraising Portals With Advanced Leaderboard Features
What it is: Full custom portal with sophisticated leaderboard features, personalized views, and admin controls.
What you get:
- Real-time updates (every 1-2 minutes)
- Personalized leaderboard views for each participant
- Multiple filterable leaderboards (by category, location, time period, etc.)
- Admin dashboard to monitor and manage
- Integration with activity tracking, badges, rewards
- Custom branding and design
Pros:
- Fully automated and sophisticated
- Handles complex campaigns at scale
- Provides best user experience
- Admin visibility and control
Cons:
- Requires significant planning and timeline
- 12-16 weeks to build
- Requires ongoing support and maintenance
Best for: Large university campaigns, sophisticated peer-to-peer programs, multi-city events, or campaigns where you’re managing hundreds/thousands of participants.
Case Study: How Columbia University Raised $2.3M Using Competition Leaderboards
Let’s look at a real example of leaderboards driving massive results.
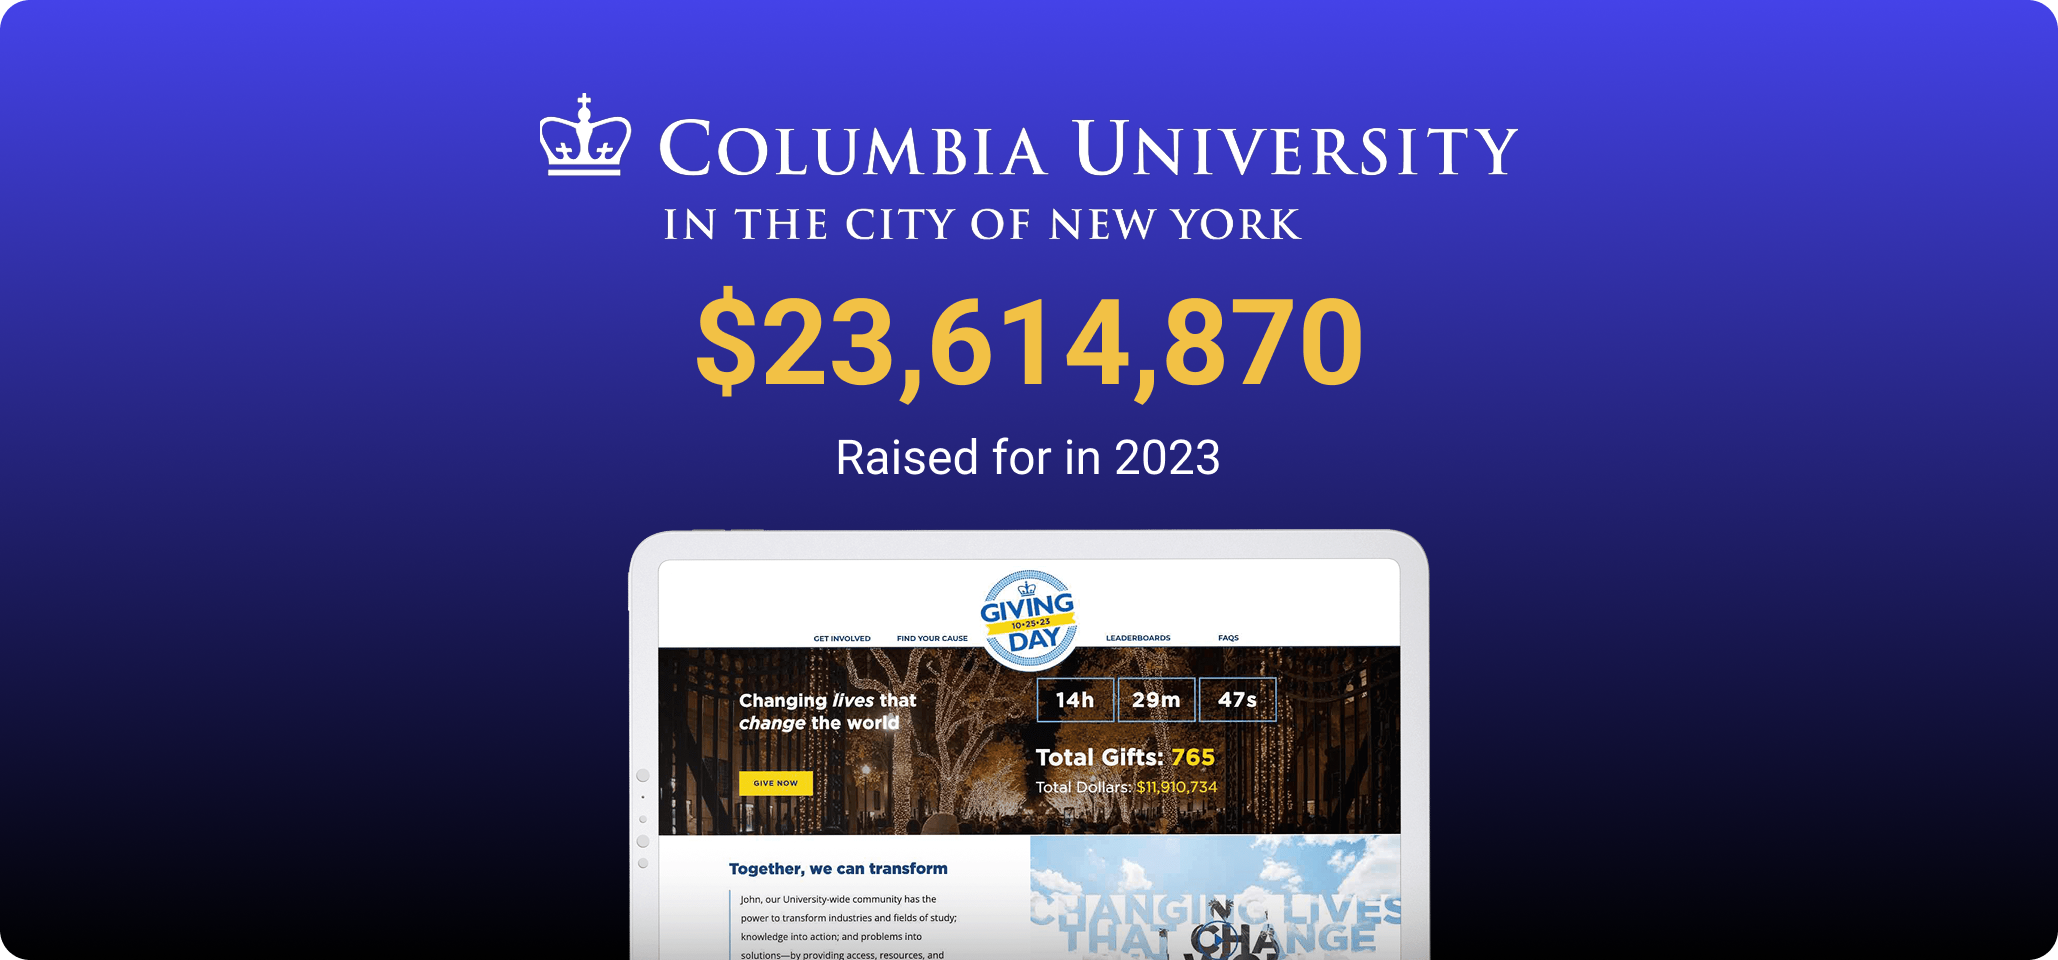
Columbia University runs an annual giving day where all schools within the university compete to raise the most money in 24 hours. Before implementing sophisticated leaderboards, the campaign raised around $1.5M annually with steady but unspectacular growth.
Then they built a custom system with multiple live leaderboards:
Primary leaderboard: Total dollars raised by school, updating every 1-2 minutes
Secondary leaderboards:
- Number of donors by school
- Class year participation rates
- Top individual fundraisers
- Biggest climbers in the last hour
The strategy:
- Launched at midnight with email and social blasts
- Schools immediately began competing
- Alumni checked rankings constantly throughout the day
- Social media filled with schools posting screenshots: “We’re #1!”
- Close races created drama: “Medicine is only $5K behind Business!”
- Power hours added extra urgency: “Double donations 2-3pm”
The results:
- $2.3M raised in 24 hours (53% increase from previous year)
- 30% more donors participated
- Average gift size increased 18%
- Social media engagement up 4x
- Schools that had never participated in top 5 got competitive
What made it work:
The constant visibility of rankings created a feedback loop. When a school saw they were #3 and closing in on #2, alumni mobilized. When a school dropped from #4 to #6, their network rallied. The real-time nature meant there were dozens of mini-competitions happening simultaneously throughout the day.
It wasn’t just about the final standings. It was about the journey—the drama of watching rankings shift, the pride of climbing, the urgency of defending a position. Leaderboards turned a fundraising campaign into a spectator sport that alumni wanted to be part of.
Common Leaderboard Mistakes Nonprofits Make (And How to Fix Them)
We’ve seen organizations implement leaderboards poorly. Here’s what to avoid:
Mistake #1: Only Showing Top 3
If only 3 people/teams ever appear on your leaderboard, everyone else stops caring. Show at least top 10-15, or better yet, show everyone with the option to see full rankings.
Mistake #2: Updates That Are Too Slow
If your leaderboard only updates once a day, it’s barely better than sending an email with results. For intensive campaigns (giving days), update every few minutes. For longer campaigns, at least every 15-30 minutes during active hours.
Mistake #3: No Movement Indicators
Static rankings are boring. Show arrows (↑↓), highlight biggest climbers, indicate who just moved into top 10. Movement creates excitement.
Mistake #4: Forgetting the Mission
Don’t let the competition overshadow the cause. Always connect rankings back to impact: “These top 5 schools have collectively funded 200 scholarships.”
Mistake #5: Making It Only About Money
Diversify your leaderboards. Some based on dollars raised, some on number of donors, some on participation rate. Give people multiple ways to win and be recognized.
Mistake #6: Not Making It Mobile-Friendly
Most people will check leaderboards on their phones. If it doesn’t work well on mobile, you’ve lost your audience.
Mistake #7: Complicated Ranking Systems
Keep it simple. If people need a tutorial to understand how rankings work, you’ve over-complicated it. Simple math, clear metrics, instant comprehension.
How to Launch Your First Fundraising Leaderboard Campaign
Ready to try leaderboards in your next campaign? Here’s your step-by-step plan:
Week 1: Planning
- Decide what to rank: Total dollars? Number of donors? Participation rate? Multiple metrics?
- Choose your approach: Manual graphics, semi-automated, or custom build?
- Define your groups: Teams, schools, companies, individuals?
- Set success metrics: What would “success” look like?
Week 2-4: Building
If manual:
- Create Canva template for leaderboard graphics
- Plan update schedule (how often will you post updates?)
- Assign staff responsibility for updates
If semi-automated:
- Get quotes from developers
- Map out data sources and integration needs
- Design leaderboard appearance
If custom:
- Interview agencies/consultants who specialize in this
- Review proposals and timelines
- Plan for 12-16 week build time
Week 4-6: Testing
- Test with sample data
- Check mobile responsiveness
- Verify update frequency works
- Train staff on how to monitor and troubleshoot
Campaign Launch:
- Announce leaderboards prominently in kickoff communications
- Share early rankings to create initial engagement
- Encourage sharing with social graphics
- Monitor engagement and iterate
Post-Campaign:
- Analyze results compared to previous campaigns without leaderboards
- Survey participants about their experience
- Identify what worked and what didn’t
- Plan improvements for next time
The Bottom Line
Leaderboards aren’t gimmicks. They’re psychological tools that tap into fundamental human motivations: competition, recognition, social proof, and loss aversion.
When implemented well, leaderboards consistently increase campaign results by 40-50% or more. They turn isolated fundraisers into competitive participants. They create urgency and momentum. They make giving visible and social.
Most importantly, they make fundraising something people want to check in on, engage with, and be part of—not just a form they fill out once and forget.
Your next campaign can see these results too. Start with a simple manual leaderboard if you need to. Test it. Measure it. Then invest in more sophisticated systems as you prove the ROI.
Because here’s the truth: Your supporters want to know where they stand. They want to see what’s possible. They want to be part of something bigger than themselves. Leaderboards give them all of that.
Ready to implement leaderboards that drive results?
If you’re running campaigns at scale where sophisticated, real-time leaderboards would make a significant impact, Mittun builds custom fundraising portals with advanced leaderboard functionality for universities, large nonprofits, and peer-to-peer programs.
We’ve built the systems behind university giving days raising $2M+, walk-a-thons managing thousands of participants, and corporate campaigns with dozens of competing teams.
Book a strategy session to explore how leaderboards could transform your campaign results.
Based on Mittun’s experience building gamified fundraising solutions for campaigns that have raised millions. For more insights on nonprofit technology and fundraising strategy, explore our blog.