
What is an impact report?
How do your donors know that your nonprofit is making an impact? Well, they don’t. Unless you tell them.
Nonprofit and food bank impact reports are data-driven documents that communicate the difference your organization made to the people or issue you are trying to help, and they promote accountability and transparency to your supporters. Phew, what a mouthful.
In a nutshell, it is a pretty powerful tool with important benefits:
People are more likely to donate their time and money to a cause that can prove its impact.
The report connects the nonprofit to its donors by illustrating what you achieved together.
What are the benefits of an impact report?
The days of yore featured impact reports that were dry, boring PDFs filled to the brim with numbers and blocks of copy in small font that were read only by big donors. Maybe. But thanks to technology, you can have an interactive, engaging webpage that offers benefits beyond telling the cut-and-dried facts:
What should an impact report include?
(and how to make it fun)
Of course, both versions of nonprofit impact reports – the outdated boring version and the exciting web-based upgrade – need to include the numbers. It is essential that you are providing factual data and financials. But how you present them makes a difference.
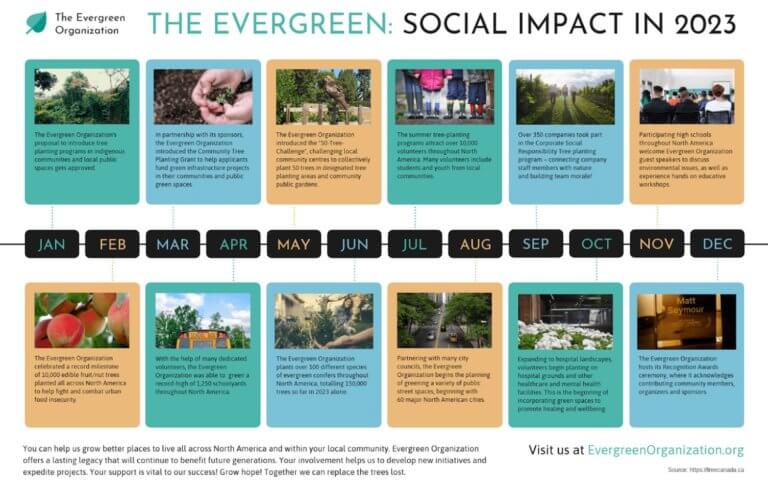
Visual Timelines
You’ve done a lot during the year, and your donors deserve to know all that you accomplished. Instead of giving them a list, create a visual timeline of your events, programs or milestones. It breaks up the monotony while also conveying the information more clearly.
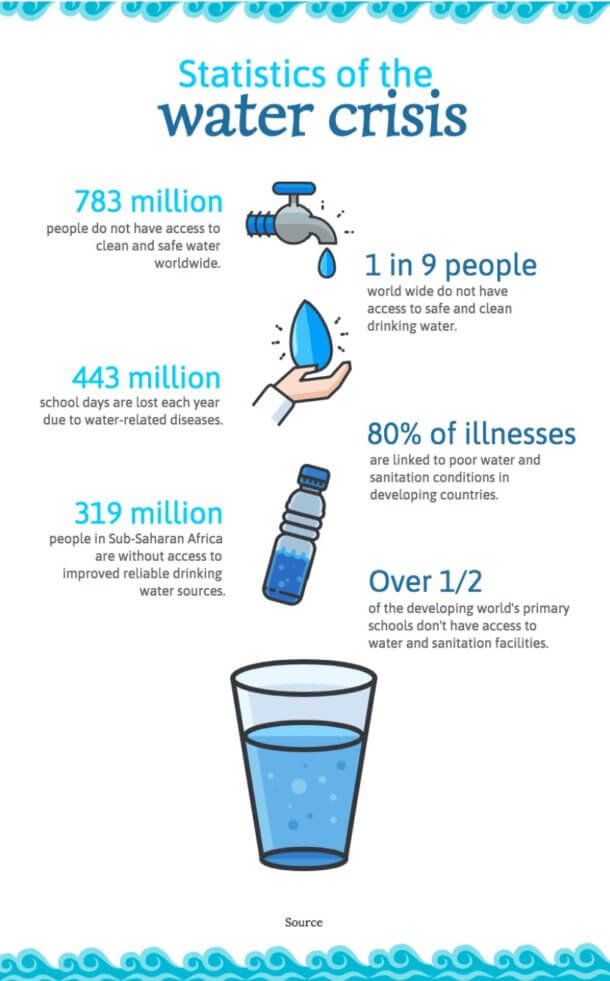
Eye-Catching Infographics
What is this, 2012? No, we are almost to 2022, and while “Infographics” may not be the trendy thing in web design the way they were nearly a decade ago, they are still highly effective in presenting numbers to a large audience.
It is important that the information in your impact report is shared in a way that connects with both your most loyal donor who knows the ins and outs of your organization and the newcomer who is learning your mission and your impact at the same time.
Infographics can be used to explain the problem you are trying to solve and your impact in an easily digestible (and sharable) format.
Stats & Figures
You are bound to have statistics, financial figures and other numerical data to share. But that doesn’t mean your readers are destined to have their eyes glaze over.
Keep it interesting with some of these options:
Progress Bar
Did you meet your goals? Exceed them? Still in progress? Let your donors know where you stand.
Pie Charts
Summarize a lot of information in a visual format using one or multiple pie charts.
Millions donated in 2020
Milestone Counters
Some numbers deserve to be shouted from the rooftop. This is the digital version.
Interactive Maps
Create a clickable map that shares your impact across the state, country or world.

Success Stories
Numbers, numbers, numbers. They share a lot about your impact, but to truly convey the difference you made, share some success stories from the year.
Ask a family how having clean water changed their life. Or talk to the young woman who is receiving a formal education for the first time thanks to funds from your donors.
Using video, photographs and testimonials, you can create a meaningful connection between the donor and the cause that might not have existed before.
”Food security is the foundation for everything. The Pantry gave that to me, leaving me time to get a better job, help my kids with homework, rebuild relationship.
Jessie CohenMother
Talking to Your Donors
Wherever you have copy, make sure it is written in a way that connects with your supporters. While it is important to make newcomers feel welcome reading the report, it is still important to use the impact report to strengthen the relationship with current donors. They deserve to feel appreciated, not just part of a marketing tool, for contributing to the impact.
Avoid Clichés
Not only is it a good way to make the report feel stale, it’s hard to connect to a cliché.
Use a Conversational Tone
Use the first person, and don’t just regurgitate your other marketing materials. Talk to your donors.
Say Thank You
Make sure your donors know the impact they made and how appreciative you are.
Check this out.
Mittun has come across and created some really amazing nonprofit impact reports. Check out some of our favorites.
Both of these tell a story. They present the information clearly, and they create a connection between the readers and the impact. They deliver factual data and financials that convey emotion. And even long after they were presented, they are still interesting to read.
Mittun offers premium website solutions for food banks and nonprofits – marketing, design, ad management, website management and more.
Are you ready to deliver an inspiring impact report? We can help.
Want help creating a memorable impact report?
Contact Mittun for a free assessment today.