
We talk a lot about how you need to test what works and what doesn’t. It is the entire idea behind agile web development. It is how you improve upon each campaign. It is how you ensure your website is an active tool for the growth of your nonprofit. But this can sound like a pretty loaded concept. How exactly do you test your site?
If you want to actually see what works and what doesn’t, you need to establish a set of rules and metrics. A good starting point is gathering the following data. If you don’t have any accounts set up yet— not to worry. Get all of these going for a minimum of 2 weeks (ideally 6 weeks) so you can get data fast.
Set up Google Analytics
What is Google Analytics?
In case you missed our Guide to Google Analytics for Nonprofits, It’s a free piece of online software that allows you to track visitor data and behavior on your website. This is a must-have and you probably already have it installed on your site.
Why should I care?
The amount of information you can gather from Google Analytics is intense. But even if you just scratch the surface, it’s important to know how many people are coming to your site and which pages are the most popular. You can also learn where they are coming from and why they are leaving.
Pro Tip: Make sure to remove your team’s IP addresses so your data isn’t skewing your results from internal testing.
How can I use this to test my site?
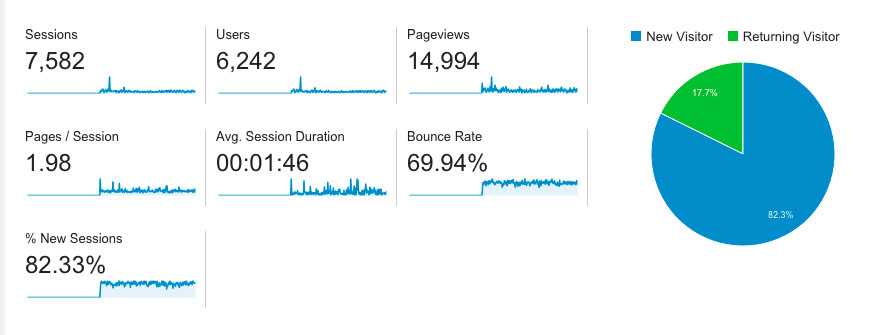
There are only about a million ways to test your site using Google Analytics. But a great place to start is tracking how many people are coming to a certain page (like your donation page) and a few of the other metrics shown in this image. By making small changes to the page and then tracking these metrics, you can determine if those changes helped.
For example, did it lower the bounce rate and increase the page views per session? That’s great! Or did the average session duration bottom out while the bounce rate skyrocketed? You should rethink the changes you just made.
Another pro tip: Don’t make too many changes at once when you are trying to track what’s working and what isn’t. If you swap out all the images and copy, and switch up the placement of the CTAs, you won’t know which element you adjusted is making the biggest impact.
Set up an account with CrazyEgg
What is CrazyEgg?
CrazyEgg is an awesome marketing tool for websites. And while it isn’t as free as Google Analytics, it can be less intimidating. It is a simple line of code you can add to your site, and it starts collecting data to help you reach your specific goals.
Why should you care?
Because you can’t get this information from anywhere else. Even from Google Analytics. CrazyEgg gives you valuable data about where people are clicking, where they are pausing, and a whole lot more.
How can I use this to test my site?
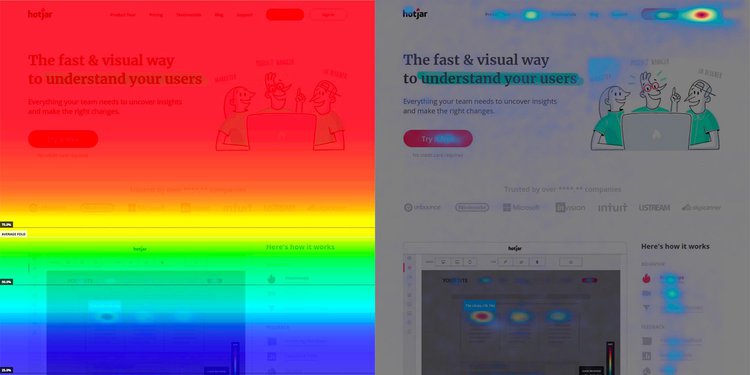
One of the most popular features of CrazyEgg is their heat maps. Heat maps show how visitors interact with a page by creating a visualization of which parts of a page are hot (popular) and which parts of a page are cold (unpopular).
In the first image, you can see how far the average user is scrolling. With the bottom of the page being blue, it means a lot of people aren’t making it all the way down. If there is pertinent information on the cold parts of the page that you want your visitors to see, you can edit accordingly.
In the second image, you can see which parts of the page are clicked the most. The navigation and CTA have the most clicks, which is great! But people are also clicking the hero image a lot too. Does that link anywhere? This type of heat map is perfect for ensuring that the page you built is understood by the majority of visitors.
Use Omniconvert to run A/B tests
What is Omniconvert?
What sets Omniconvert apart from other website optimization tools is that it is one of the few A/B testing tools that focuses on retention. It isn’t enough to get one visitor to convert (donate, sign up to volunteer, etc.), you want to stay on their radar. And that is where Omniconvert steps up.
Why should you care?
What if something simple was keeping visitors from acting on your site? Every element of a webpage matters, and something as simple as switching out the copy on a button or replacing images can have a huge impact. That is where A/B testing comes in. You can adjust one variable to see how it impacts your goal.
How can I use this to test my site?
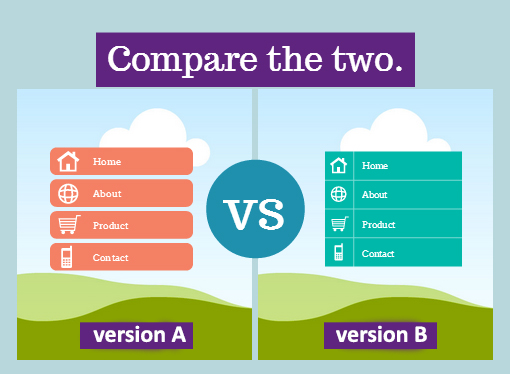
Let’s say you want to see how the headline on your home page is working. You can set Variation A as the original headline, and then create a Variation B that swaps out the headline with a new line of copy. Every other aspect of the page stays the same. Using these tools, half of the visitors to your site will see Variation A and the other half will see Variation B without even knowing it is a test.
After you let the experiment run for a bit, you’ll get valuable data. You might get information like “this headline gets 37% more CTA clicks.” Once you know which one “wins” the experiment, you can end the A/B test and set the page to whichever one was most effective.
Next Steps
Testing what works and what doesn’t on your website is essential. You can make all the guesses you want, but without the data, you won’t know for sure if your efforts are effective. After just a few weeks, you will have more confidence in the choices you make for your nonprofit and more to show for them.
The tools in this blog post are ones that you or your team could take on yourself, but they only skim the surface of web testing. If you want more suggestions or want help making your website the best it can be, Mittun’s got you covered.